Special Populations
Catchment Area Special populations
The figure below shows the respective age-adjusted incidence rate, from 2015 – 2019, for the top 15 cancer sites for the Catchment Area. Each cancer site is broken down by race and ethnicity to show similarities/difference between the rates for each group.
Disparities include prostate cancer incidence among Black/African American men compared to White men.
The Black/African American population has the highest incidence rates of prostate, colon & rectum, corpus uteri & uterus NOS, cervix uteri, and pancreas cancer.
Racial Disparities: What cancer disparities exist among the Black population?
Top 15 Incidence Rates and Corresponding Mortality Rates for the Black Population
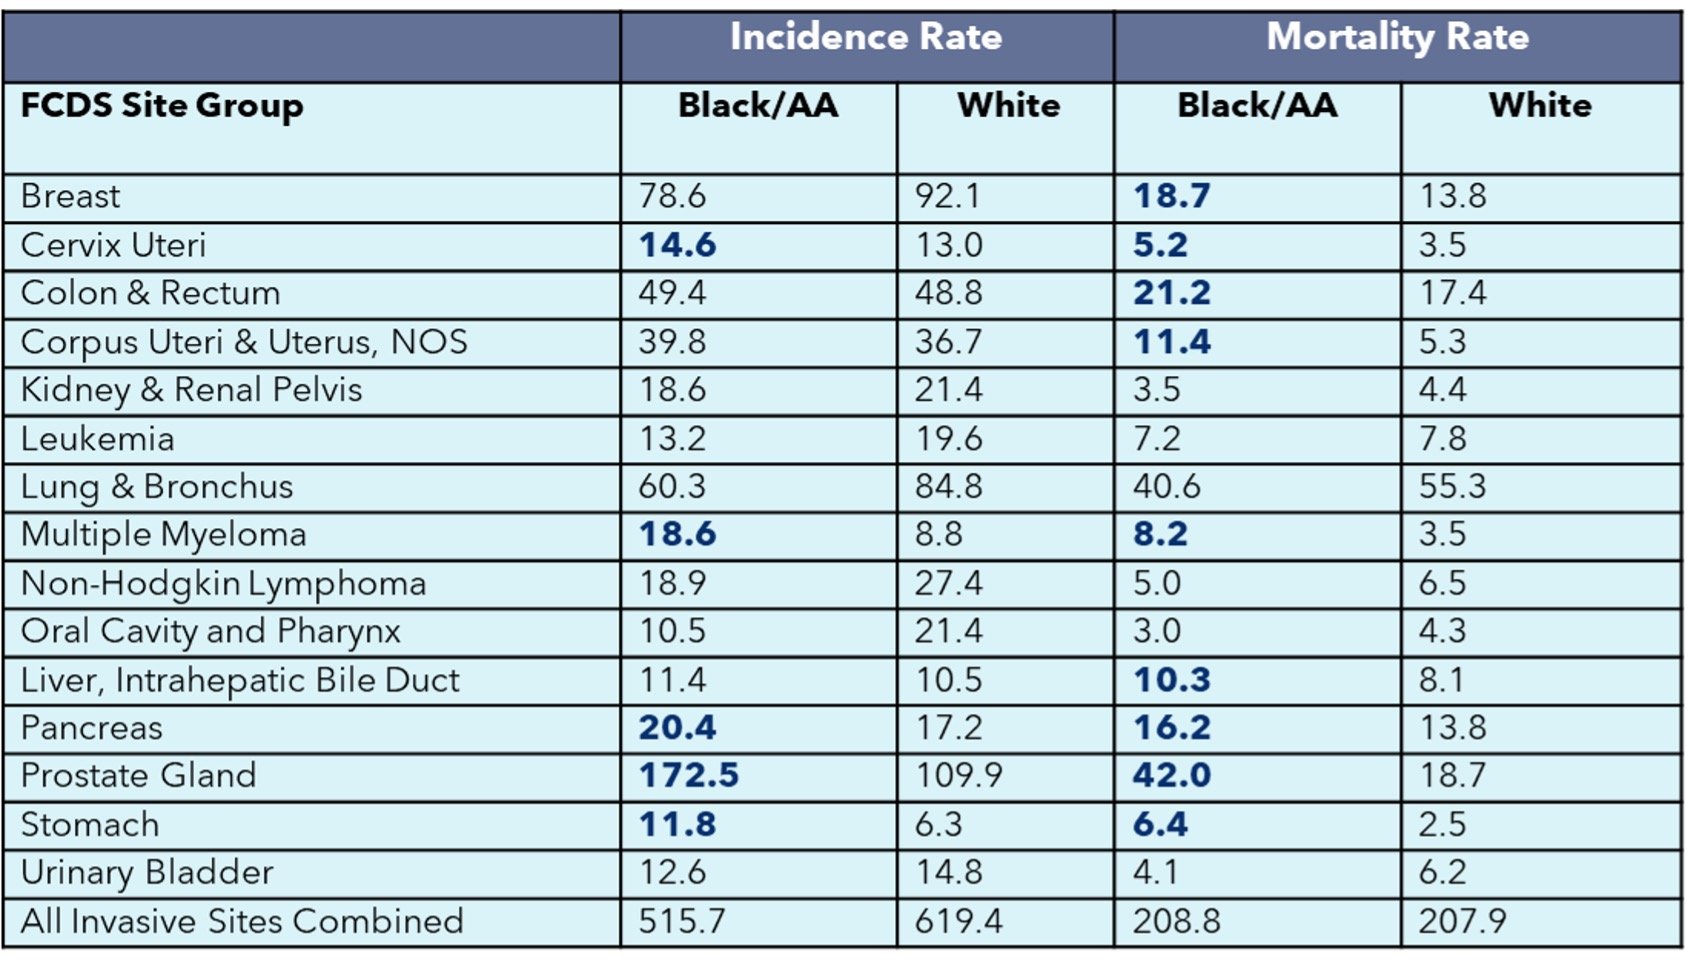
*Bolded text shows which cancer site rates are 10% higher in the Catchment Area compared to the NHW population
Florida Cancer Data System (FCDS) 2015 – 2019 Cancer Incidence Rates, Invasive Cases Only, Ages ≥ 20. (Urinary Bladder Consists of Invasive and InSitu Cases); Florida Bureau of Vital Statistics, 2015 – 2019 Mortality Dataset; CDC Wonder, Cancer Incidence and Mortality Statistics 2014 – 2018, Ages ≥ 20.
Cancer disparities in Non-Hispanic Black Catchment Area Population
- Incidence & Mortality: cervix, multiple myeloma, pancreas, prostate, stomach (vs. NHW)
- Mortality: breast, colorectal, uterine, liver (vs. NHW)
Ethnic Disparities: What cancer disparities exist among the Hispanic population?
Top 15 Incidence Rates and Corresponding Mortality Rates for the Hispanic Population
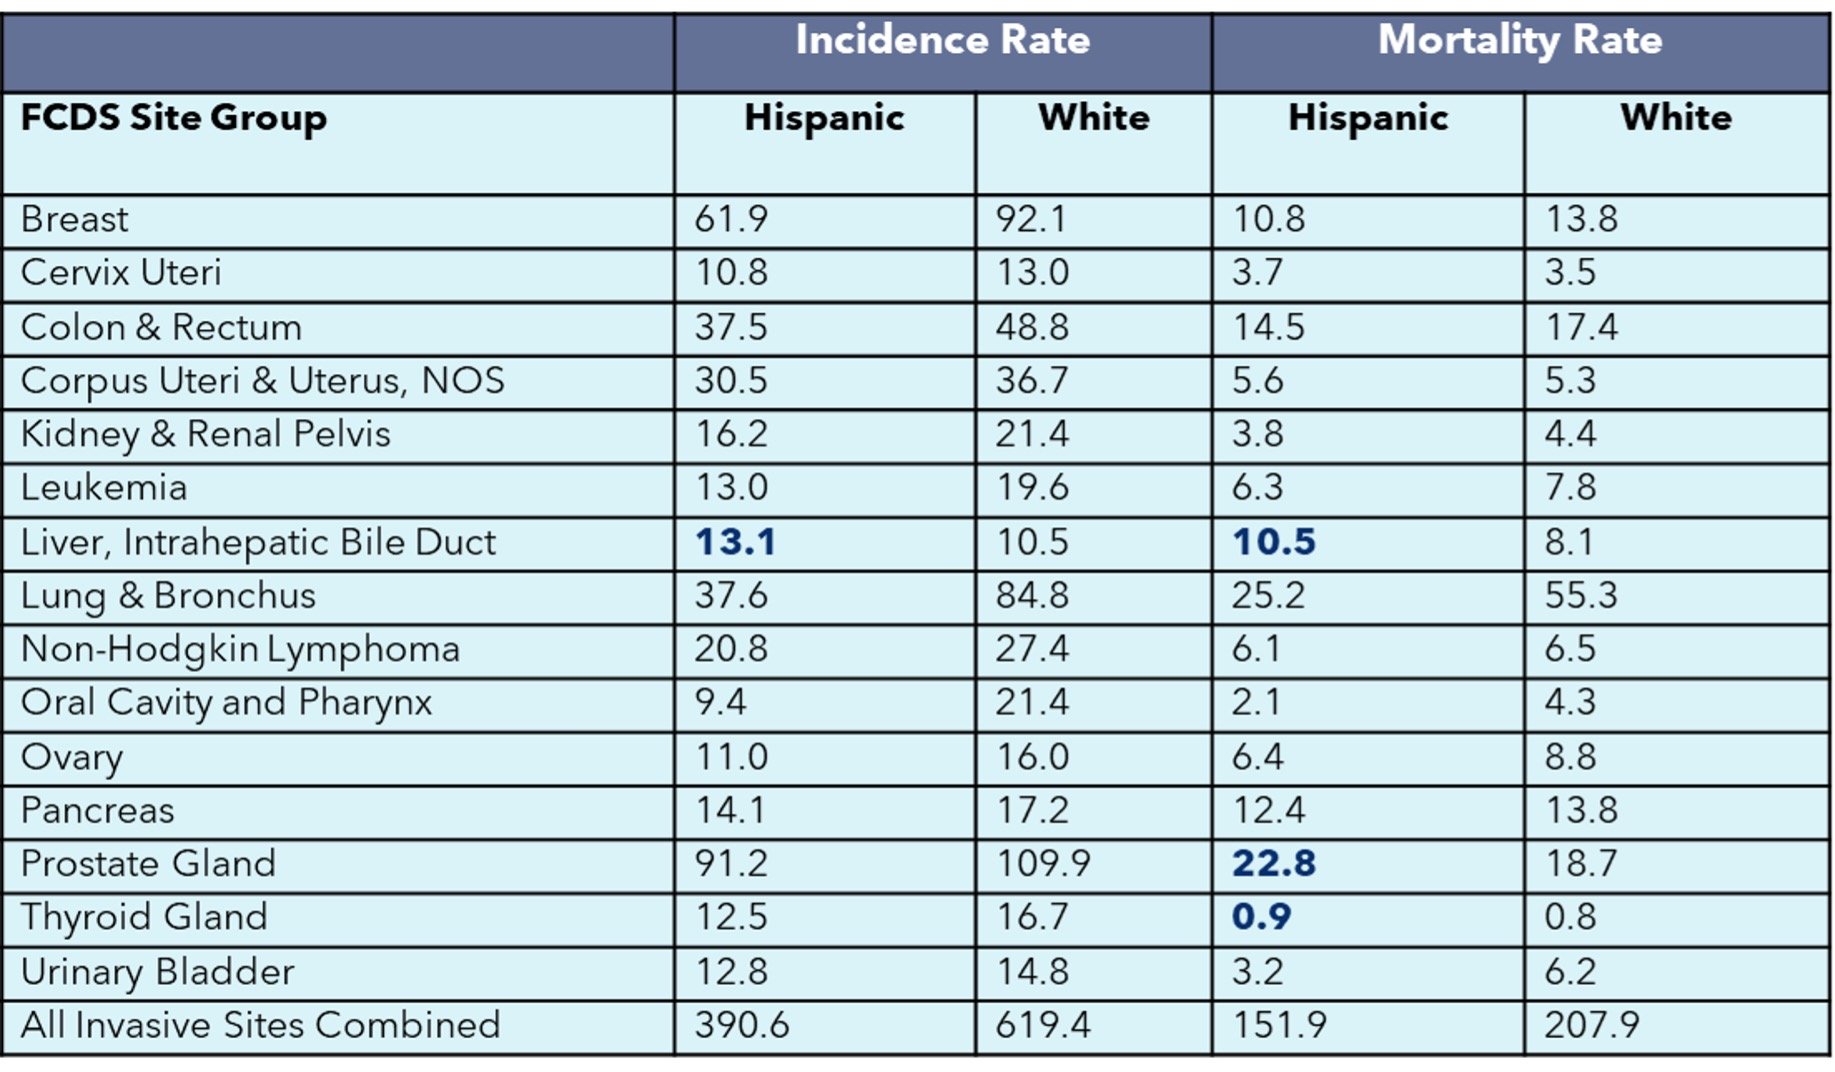
*Bolded text shows which cancer site rates are 10% higher in the Catchment Area compared to the NHW population
Florida Cancer Data System (FCDS) 2015 – 2019 Cancer Incidence Rates, Invasive Cases Only, Ages ≥ 20. (Urinary Bladder Consists of Invasive and InSitu Cases); Florida Bureau of Vital Statistics, 2015 – 2019 Mortality Dataset; CDC Wonder, Cancer Incidence and Mortality Statistics 2014 – 2018, Ages ≥ 20.
Cancer disparities in the Hispanic Catchment Area Population
- Incidence & Mortality: liver (vs. NHW)
- Mortality: prostate, thyroid (vs. NHW)
Rural population
What cancer disparities exist in the rural population?
Top 5 Incidence Rates and Corresponding Mortality Rates in the Rural Population

Elderly population
Cancer in the elderly (65+) population accounts for 63.17% of all cancers in Moffitt’s catchment area. (FCDS, 2015-2019)
Top 5 Cancers in the Elderly (65+) Population
- Prostate Gland: 432.5
- Lung & Bronchus: 302.1
- Breast: 212.7
- Colon & Rectum: 140.9
- Melanoma of the Skin: 116.3
Percent of Elderly Cancer Contribution to the Catchment Area, 2015 – 2019 (n = 308,102)
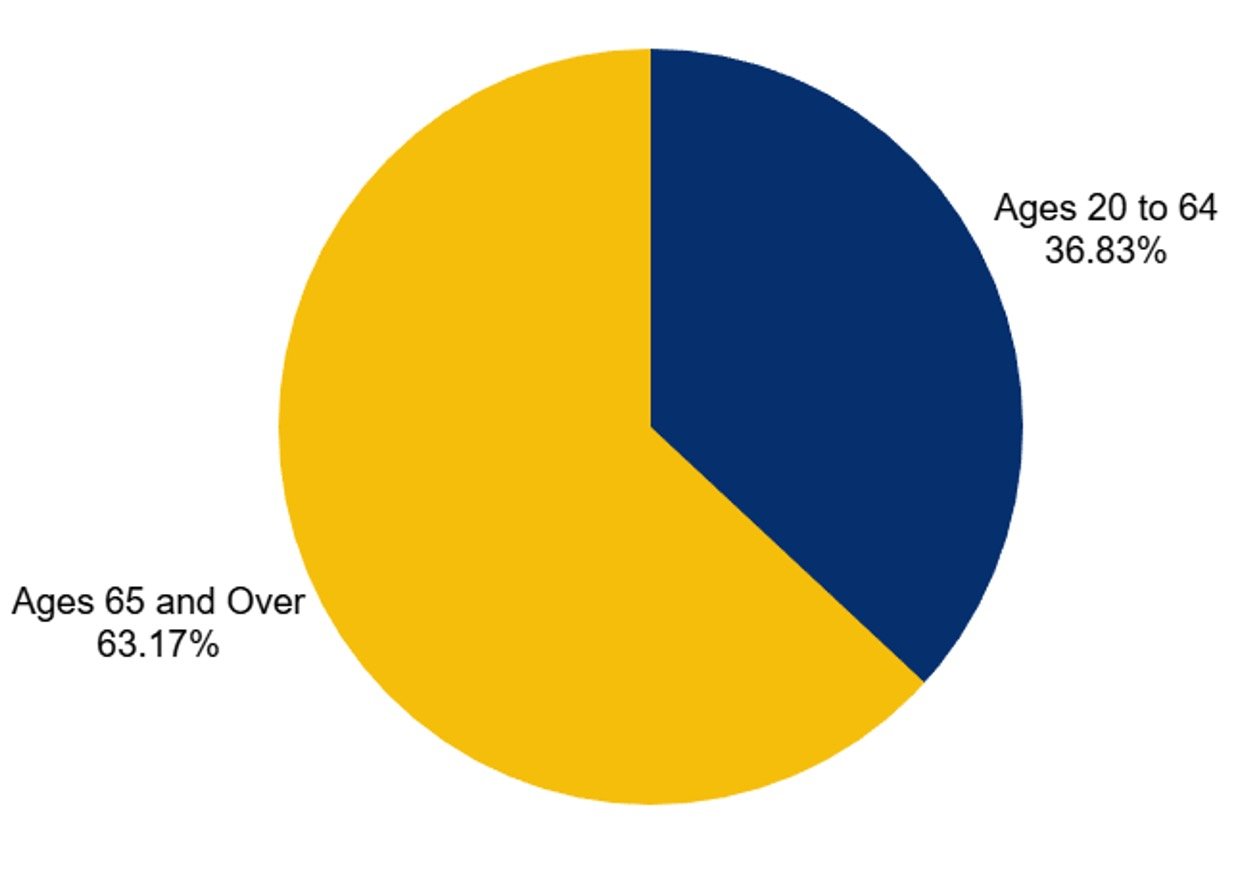
Florida Cancer Data System (FCDS) 2015 – 2019 Cancer Incidence Rates, Ages ≥ 65.
Top 10 Incidence Counts vs. Death Counts for the Catchment Area Elderly Population
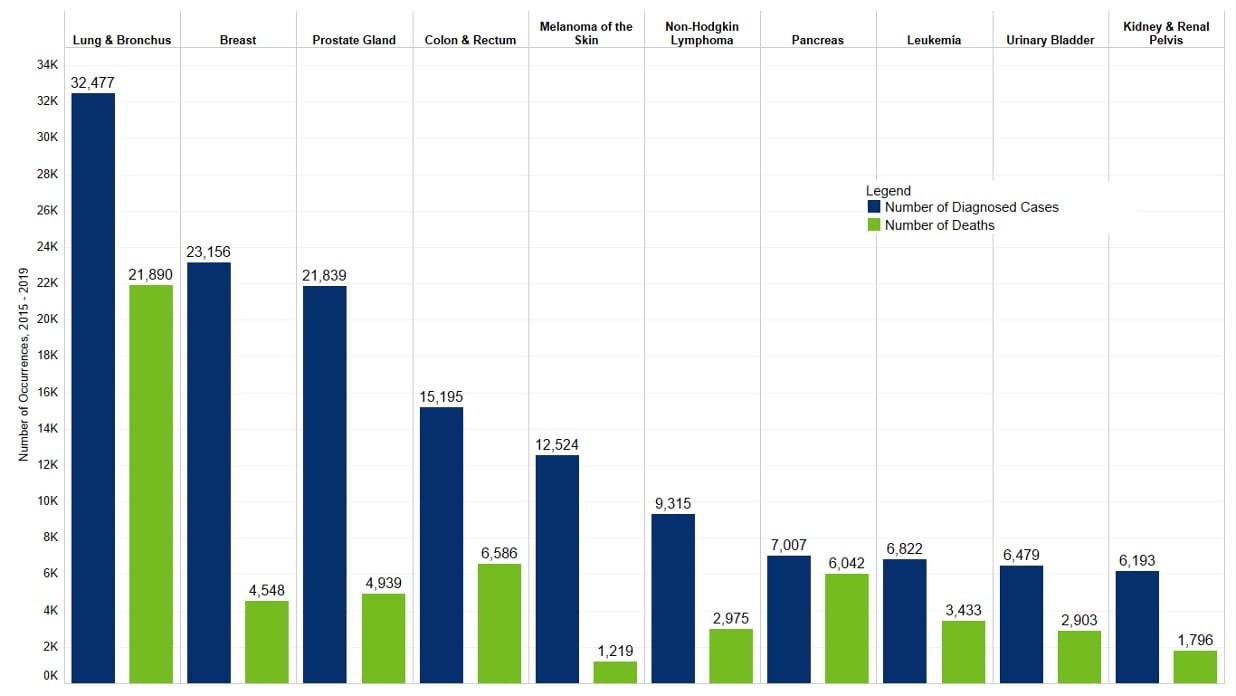
Florida Cancer Data System (FCDS) 2015 – 2019 Cancer Incidence Rates, Ages ≥ 65. (Urinary Bladder Consists of Invasive and InSitu Cases; Florida Bureau of Vital Statistics, 2015 – 2019 Mortality Dataset.
Catchment Area Cancer Data